An update is available for Restaurant Pro and Delivery Pro customers. We have made changes to the layout of the Daily Sales and Tips Report/Server Sales and Tips Report. This article will walk you through the new layout of the Daily Sales and Tips Report for Restaurant POS customers, and the Server Sales and Tips Report for Restaurant Delivery POS customers.
You will need to update your BPA software to enable this feature. Give our technical support a call at 801-336-3303 to help you perform this update.
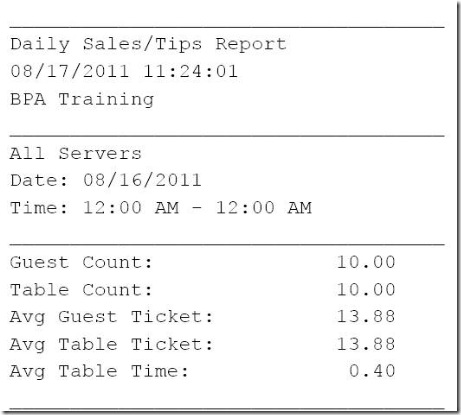
Figure 1
The top of the report (Figure 1) shows the total number of guests and tables (Guest Count and Table Count). You also see the average check total per guest and per table (Avg Guest Ticket and Avg Table Ticket). Finally, you can see the average time each table was open (Avg Table Time).

Figure 2
The next section (Figure 2) will show you the Total Sales and Tax for the time period specified. Tips are not included in these figures…this section will only include the sales of your products. Comps, Voids, and Discounts have already been accounted for in this Total Sales figure…no adjustment is necessary for these items.
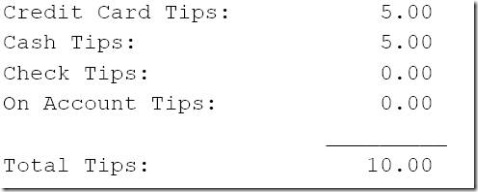
Figure 3
The Tips section of the report (Figure 3) calculates all tips entered into the system, and breaks these figures down by payment type. If you do not enter the gratuity at the end of the sale, these lines will not be populated.
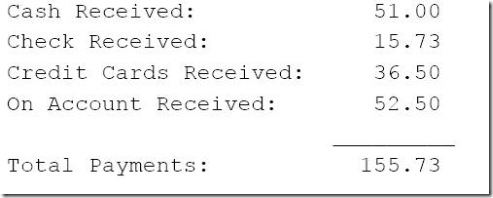
Figure 4
The next section (Figure 4) shows the Total Payments Received, broken down by payment type. These numbers include the total sales, taxes, and tips received.

Figure 5
The Cash – Tips (Cash minus Tips) and Server Owes lines (Figure 5) can be used for servers who carry their own banks. With these lines, you can know how much money the server needs to turn in to the restaurant.
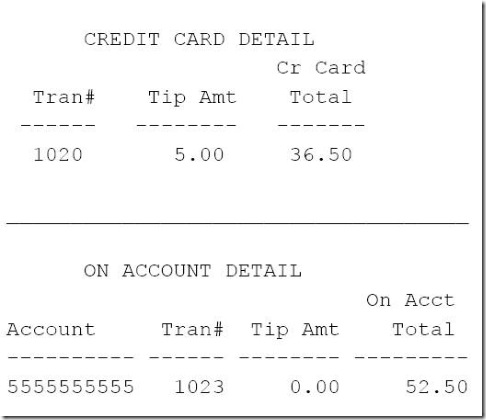
Figure 6
The next section of the Report (Figure 6) breaks down the individual credit card and on account transactions that has been entered into the system.
NOTE: For customers with integrated credit card processing (X-Charge, PPI, Payware PC), transactions with an askterisk (*) next to them were not processed by your credit card processor. This occurs when the sales was closed as a credit card sale, but, the credit card was never authorized.

Figure 7
The Comps and Discount lines (Figure 7) shows the total dollar value of items that were comped or discounted. Comps and discounts have already been accounted for in the Total Sales figure. You do not need to make any adjustment for comps.
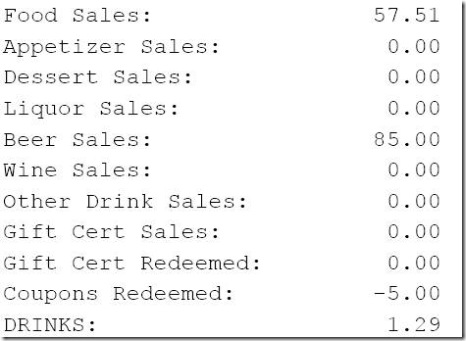
Figure 8
The last section of the Report (Figure 8) breaks down the individual categories of products that have been entered into the POS system. These categories are defined by each item’s Product Type. Thus, for all of your products you have defined in the BPA software, you should ensure that an appropriate Product Type is associated with them.
For more information on setting up Product Types, you can refer to the BPA Restaurant Quick Start Guide or the BPA Restaurant Delivery Quick Start Guide
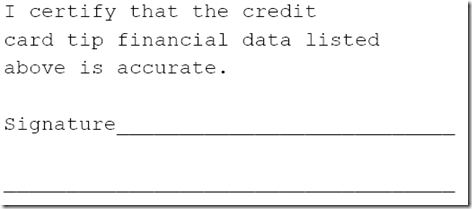
Figure 9
For restaurants that keep copies of the reports, the last Signature line (Figure 9) can be signed by employees and managers for future reference.